
by James Taylor,
The team at CLEREL is researching and developing methods to incorporate information from high-resolution canopy sensors into Concord (and Niagara) production systems. Two sensing systems are being trialed; the N-Tech GreenSeeker and Holland Scientific CropCircle. These canopy sensors operate by measuring the reflectance of visible (Blue, Green and/or Red) and Near Infra-Red (NIR) light from the leaves. The amount of reflectance is dependent on i) the number of leaves and ii) the health (color and cell structure) of these leaves.
By measuring the canopy response and looking at the variation within a field or vineyard, it is possible to identify areas of low, medium and high vigor vines. Understanding this variation within a field, will provide information that allows growers to quantify (properly measure) under producing areas and the cost of potential lost crop production.
What does the NDVI (Normalized Difference Vegetation Index) mean?
The most common way that the information from canopy sensors is displayed is as a Normalized Difference Vegetation Index (NDVI). The NDVI value is a ratio between the reflectance of Red and NIR from the canopy. Healthy green plants absorb Red light for photosynthesis (i.e. they have a low Red light reflectance), but strongly reflect NIR light. Good leaf cell structure (again indicating healthy plants) leads to higher NIR light reflectance. Therefore vigorous plants should have a low Red and high NIR light reflectance while weak plants will have a relatively higher Red and lower NIR light reflectance. The ratio between Red and NIR therefore forms a good basis for identifying low and high vigor plants based on their canopy reflectance.
Sensor operation
In a practical sense, canopy sensors are operated by imaging (pointing at) the part of the vine where differences in vine growth are expected. Early in the season the sensor can be directed at growth around the top wire cordon (Figure 1a). At this stage of growth the sensor will differentiate between weak and strong early season growth. As the season develops, all vines develop a thick canopy around the top wire. This leads to a saturation of the sensor signal. When the canopy is complete along the top wire there is little or no difference in the sensor response between low and high vigor vines.
At this stage the sensor can be moved from imaging the top wire to imaging the side-curtain of the vines. Typically the sensor should be mounted about 18 inches above the ground (around the bottom wire if present) (Figure 1b). The rationale here is that vigorous vines will have a well-developed side-curtain with long canes that will present a large amount of leaf to the sensor low down on the side-curtain. Weaker vines, with fewer and/or shorter canes will have less leaf material in the same area. Examples of these differences are shown with photos from a vineyard in Figure 2. The difference in side-curtain development allows the sensors to map differences in vine vigor.

Figure 1: Examples of a canopy sensor being used (A) early in the season to sense early season development and (right) late in the season to sense differences in the canopy side-curtain development.

Figure 2: Photos of the difference in side canopy development in (A ) low vigor and (B) high vigorvines within a Niagara block at CLEREL.
Interpreting NDVI maps
NDVI is a normalized or relative response. The sensor output will be very dependent on how the canopy (vine) is presented to the sensor. As stated above, if the top wire is imaged late in the season, then the sensor will always see a full canopy and will interpret all vines to be of high vigor. The schematic presented below (Figure 3) shows how the sensor response may differ with different canopy architectures. On the top line of Figure 3 it is easy to see how imaging the side canopy (the red zone) shows an increase in sensor response (from low to high NDVI) as vine size increases from 1.5 to 3.5 lbs/vine. The example here is in a hand-pruned vineyard on a constant 6 foot high trellis. The second line in Figure 3 shows some alternate canopy architectures. Machine pruning tends to generate a greater canopy density along the top wire than hand-pruning. Consequently, the side-curtain may be less developed than in hand pruned vineyards for a similar sized vine. Both vines (b) and (d) are 2.5 lbs. vines but the NDVI response from imaging low down on the canopy side-curtain will be relatively lower in the machine pruned vineyard. This is only due to the difference in canopy architecture between hand and machine pruning, not a difference in vine size or productivity. The same can be seen for vines (c) and (e) that are both 3.5 lbs. vines, but again differ in pruning management and NDVI response. A change in the trellis system will also affect the sensor response. Vines (b) and (f) are both 2.5 lbs. vines; however the trellis height for vine (f) is shorter so that the relative position of the canopy sensor is closer to the top wire. As a result, vine (f) presents more foliage and an apparently higher NDVI for the same size vine with the same pruning management. Note also the difference in NDVI response between the taller trellis machine pruned vine (d) and the shorter trellis hand pruned vine (f). Both vines (d) and (f) have the same pruning weight.
Keypoint: Management will affect the relative sensor response. The patterns in the NDVI maps should only be interpreted within a single block or between blocks that have the same management!!
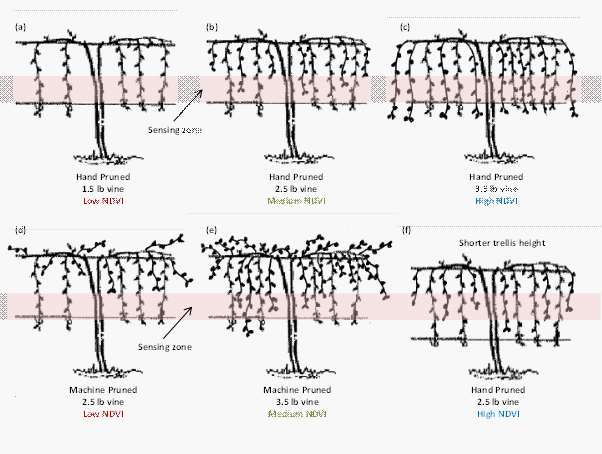
Figure 3: A schematic diagram to illustrate how the response of a canopy sensor that is sensing
along the bottom trellis wire may be affected by differences in pruning strategies and trellis set-up.
Comparing the NDVI response between blocks with a different variety, different pruning regime or different management is very difficult and can lead to misinterpretation. It should not be done. The main interest is to look for patterns within a block or within uniform management areas that indicate where vine vigor (size) is relatively small or large. If desired, the canopy sensor data can then be calibrated to a pruning weight by taking pruning weight measurements within the block. Otherwise, the patterns in the NDVI can be used to target sampling (soil, petiole etc.) to identify production limiting factors in the low vigor areas and (hopefully) remedy these factors. The effect of management can be illustrated with real data on the NDVI response from the juice grape blocks located at CLEREL, Portland (Figure 4). There are four large juice grape blocks at CLEREL – 3 Concord blocks (Blocks A, B and D) and 1 Niagara block (Block C). The response between the Concord blocks A (very vigorous) and D (low vigor) is very different. Without any information on these production systems it may be assumed that Block A is much more productive than Block D. However the difference in NDVI is in large part due to the fact that Block D is machine-pruned whilst Block A has been very carefully hand-pruned for the past 4 years. Consequently the presentation of the canopy to the canopy sensor differs in the two blocks and the difference in the NDVI signal is, therefore, not necessarily reflected in the production (yield) response (see Figure 3). The intensive hand-pruning in Block A has been done to ensure that the canopy side-curtain is fully developed in an ‘ideal’ hand-pruned system. This level of attention is obviously not feasible in (large) commercial production systems, which are increasingly adopting machine-pruning approaches.
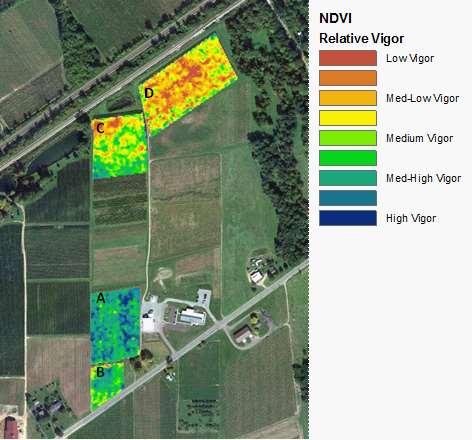
Figure 4: The NDVI response for the juice grape blocks at CLEREL Portland. Blocks A, B and D are Concord, Block C is Niagara.
Keypoint: The canopy sensor data tells you where to look to identify problems in the vineyard. It does not tell you why vine vigor is low. Some agronomy and management expertise is needed to interpret the patterns and develop a management strategy for the observed variation in vine vigor.
During the 2012 growing season the team at CLEREL imaged ~ 750 acres of single wire top-wire trained Concord grapes in the Lake Erie region. This included vineyards from the east (Sheridan) to the west (Harborcreek) of the grape belt and vineyards, ranging in elevation from the lakeshore to the escarpment and included hand and machine-pruned vines. Over the coming months, work will continue to measure pruning weights within these vineyards to establish calibration curves between the NDVI response and vine size. This will allow the canopy sensor response to be converted to a site-specific pruning weight (vine size) estimation across a range of different management environments.