by Rhiann Jakubowski
Anyone who has been in contact with the Lake Erie Regional Grape Program (LERGP) within the last few years has probably heard the terms “NDVI” and “GIS” used quite frequently. With all of the discussions about vineyard mechanization and precision viticulture, what are NDVI and GIS, and what are some of the applications that are pertinent to those in the grape industry?
GIS:
What is it?
A Geographic Information System (GIS) is a system that allows for spatial, or geographic, data to be interpreted in a digital format. In this way, data can be more easily stored, shared, manipulated, analyzed, and understood. For our purposes, you will hear me use the phrase “GIS” to describe a computer program, ArcGIS (developed by ESRI). ArcGIS is a platform that allows the user to create, load, and overlay datasets in a variety of ways. When you hear “GIS”, think “maps”!
How is it used at LERGP?
We began the GIS Mapping Project back in 2011 at LERGP as a way to gain a better understanding of the distribution of vineyards and grape varieties throughout the Lake Erie grape belt. Since then, the vineyard polygons GIS layer has been an invaluable resource for research and extension projects at CLEREL.
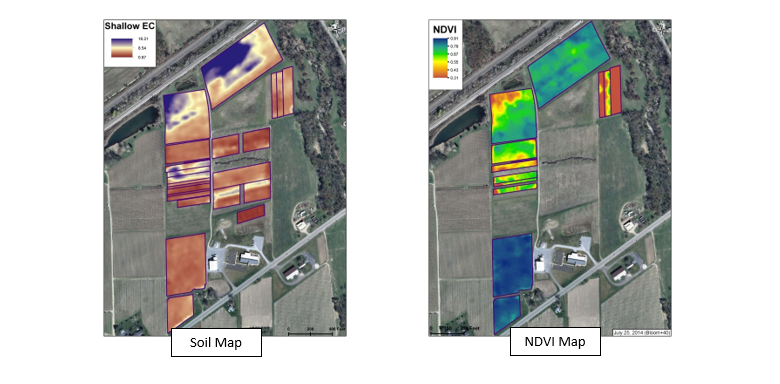
One of the most notable projects is the collaboration between the Lake Erie Regional Grape Program and National Grape Cooperative to provide all members (of either organization) with accurate acreage maps of their vineyards. These maps are considered the foundation of precision viticulture as more layers of data (NDVI, soil, elevation, etc.) can be overlaid in order to interpret underlying relationships within specific vineyard blocks.

GIS has also been used to map the relationships between frost events and bud damage in 2012, as we split the region into distinct growing zones based on field-collected data. We will be exploring the effects of the severe cold events in February of 2015 on bud damage in a similar manner utilizing our GIS resources.
NDVI:
What is it?
Normalized Difference Vegetative Index (NDVI) is a formula that is used to quantify the density of plant growth in a particular area. No green leaves results in an NDVI value of zero, while healthy, dense leaves result in an NDVI value near +1. Chlorophyll, the green pigment in plant leaves, strongly absorbs visible light during photosynthesis. However, near-infrared light is strongly reflected by the plant’s cell structure. As a result, the more photosynthesizing leaves that a plant has, the more the Red and near-infrared (NIR) wavelengths of light are affected, thus changing the NDVI value.

To keep it simple, when you hear “NDVI” think of “green leaf area”!

How is it used at LERGP?
For the past few years, LERGP has been collecting NDVI readings from research and grower vineyards during various times throughout the growing season to discover if there is a relationship between vine vigor, yield, and crop load. Using the results from the NDVI canopy sensing combined with the data from soil sensing, our viticulturalist, Luke Haggerty, can help growers to make educated management plans to reduce variability within vineyard blocks and increase vine productivity. Remember, the NDVI sensor will not tell you why vigor is low; it will only show you that canopy size is different within your block.
The NDVI sensors are mounted on a tractor, gator, or other piece of machinery and driven through a vineyard on an every-other-row or every-third-row pattern, with the sensors aimed at the growing region of the vines. The data collected is then processed at the lab using GIS and other computer programs to create a map that the grower can use to visualize variability within the vineyard. This information has proven especially useful during crop estimation sampling or other directed sampling.